
This post was originally published here (Center on Nonprofits and Philanthropy)
This yearly publication reviews the individual charitable contributions reported on itemized tax returns published by the Internal Revenue Service from all 50 states and the District of Columbia. This brief finds that total itemized charitable contributions and the average itemized charitable contribution per tax return in the United States increased from 2008 to 2013.
Each summer, the Internal Revenue Service (IRS) publishes selected data from individual tax returns filed during the previous calendar year that include ranges of adjusted gross income (AGI) and deductions for charitable donations. The National Center for Charitable Statistics at the Urban Institute has summarized charitable giving by state and tracks changes in charitable giving across states and over time.
Data Limitations
The source of the data on charitable giving is the Statistics of Income Bulletin, published by the IRS. Since only returns with itemized contributions are included, IRS data do not account for all contributions. In 2013, 30 percent of US taxpayers chose to itemize deductions on their returns. This means that more than two-thirds of US taxpayers take the standard deduction, and thus, no details on their charitable contributions are available. No one knows how much nonitemizers donate to charity, although some researchers have created estimates. For example, Giving USA, published by the Giving USA Foundation, estimates that total individual giving in the United States was $240.6 billion in 2013. Based on this estimate, the $195.3 billion reported as itemized contributions on 2013 tax returns represents 81 percent of all individual giving.1 The 2013 data on itemized deductions used in this analysis, therefore, cover about one-third of US taxpayers and over four-fifths of the charitable contributions. Thus, in spite of the limitations, analyses of the data can provide information on giving patterns.
Findings
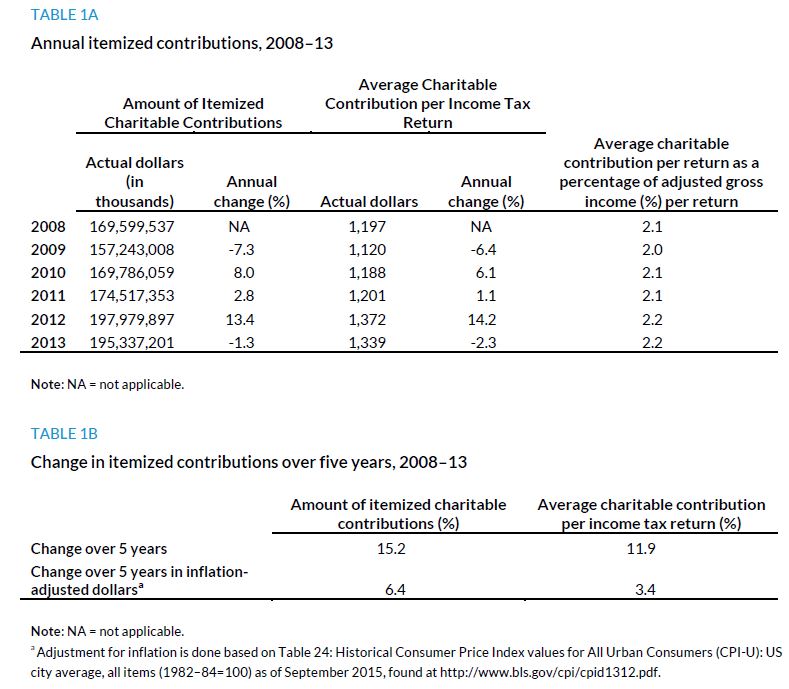
Total reported charitable deductions were $195.3 billion in 2013, compared with $198.0 billion in 2012, a decrease of 1.3 percent.
The average charitable contribution per return filed in 2013 was about 2.2 percent of income. Contributions as a percentage of income varied from 1.3 percent in Maine, North Dakota, and West Virginia to 4.7 percent in Utah. Though the average charitable deduction per return was $1,339 in 2013, state averages ranged from $605 in West Virginia to $2,722 in Utah.